A WebOps Postmortem
Early in the day, May 18, 2017, alerts started appearing from our Content Distribution Network that a number of user requests were being served with 504 Gateway Timeout responses.

I lead the Production Engineering team at Seven West Media in Western Australia and the alerts indicated an issue with thewest.com.au.
Our internal process did produce a postmortem report that differs from this one, but only in formality, not in terms of the facts. This is my summarized and more technically focused treatment of the incident.
I hope to highlight here some of the principles that we employ that were advantageous to us, as well as simply exploring an interesting problem that reminded us to stay humble.
While reports came in from our colleagues and customers that images were failing to display on the site, a killer team of Developers and SysAdmins invoked our Incident Response process. We borrow heavily from ITIL Incident Management and Google’s Site Reliability Engineering.
The process calls for us to stay calm, objective and to seek out quality information for better decision making.
Network I/O deviations
Initially we discovered unusual network I/O patterns on our Content API servers.
The Content API is a Node.js/Express application fronted by a local instance of nginx. It is responsible for serving article content, listings, curations, etc. to both our internal web servers (for server-side rendering) and to our client-side Javascript which uses the Single-Page Application model (see: Isomorphic Javascript: The Future of Web Apps). It also serves static assets, such as images, which it pipes directly from Amazon S3.
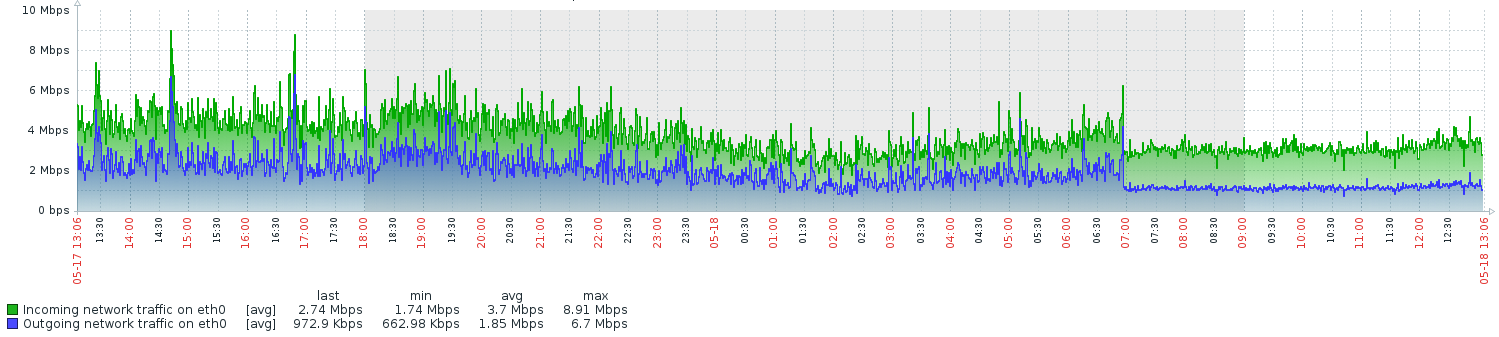
The above figure from Zabbix shows that network I/O became more “ordered” on one of the Content API instances around 7 AM. A brief exploration of Complexity Theory teaches us that things go wrong when systems transition to exhibiting ordered behaviors.
We employed Brendan Gregg’s USE method to build a clearer picture of network performance. We observed:
-
throughput between each component was otherwise typical, with plenty of headroom
-
no dropped packets, interface errors or other known TCP/IP issues that would indicate saturation or congestion
-
no error messages in any of the counters or logs we knew to check
-
no network issues were being reported by AWS
-
Health checks on the Content API servers were passing
There was one important metric that we neglected to check for saturation but more on that later!
HTTP 499 errors
One fastidious engineer noticed something else amiss: a large number of 499 Client Closed Request responses being logged by nginx on the same Content API servers.
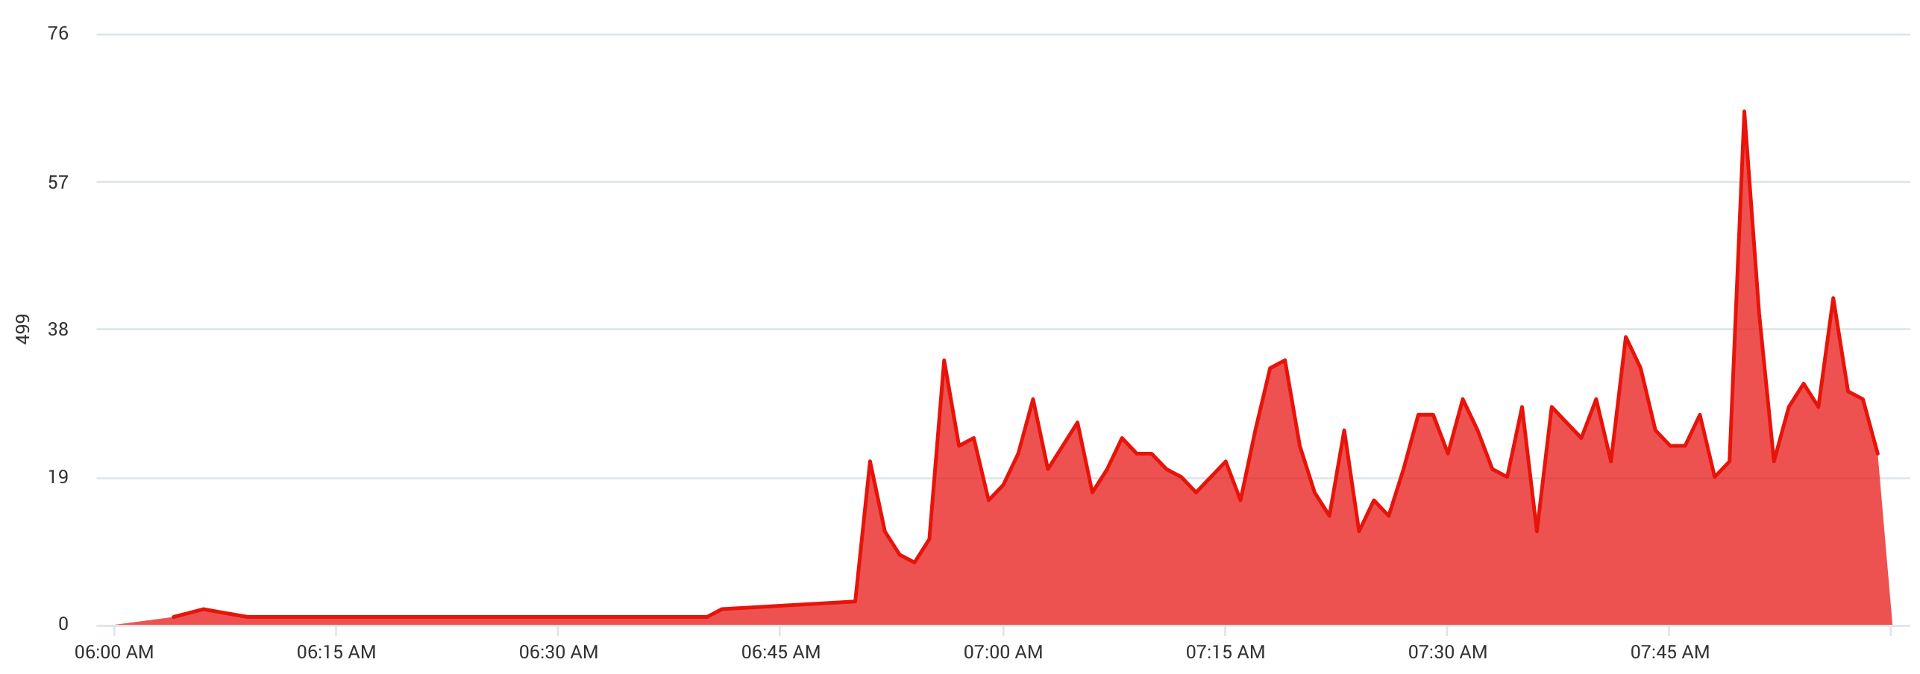
The above screen grab from Sumo Logic of the same instance shows the uptick in 499 status messages at the same time that the network I/O anomaly appeared. The uptick is obvious in this image, but it was visually masked on our dashboards by the thousands of successful requests occurring at the same time.
Reviewing the nginx logs on each server revealed an interesting pattern that helped us to understand the scope of the issue: all 499 responses were constrained to static assets only. Requests for dynamic content were unaffected.
This finding was easy to confirm locally on any of the production servers. A
quick $ curl -iv http://localhost/... for any static asset would
hang until the client cancelled the request. The same curl request for any
other resource behaved as expected.
This test also validated that no error was logged via nginx or the Node.js application. The application logs did show an incoming request but no outbound response or error.
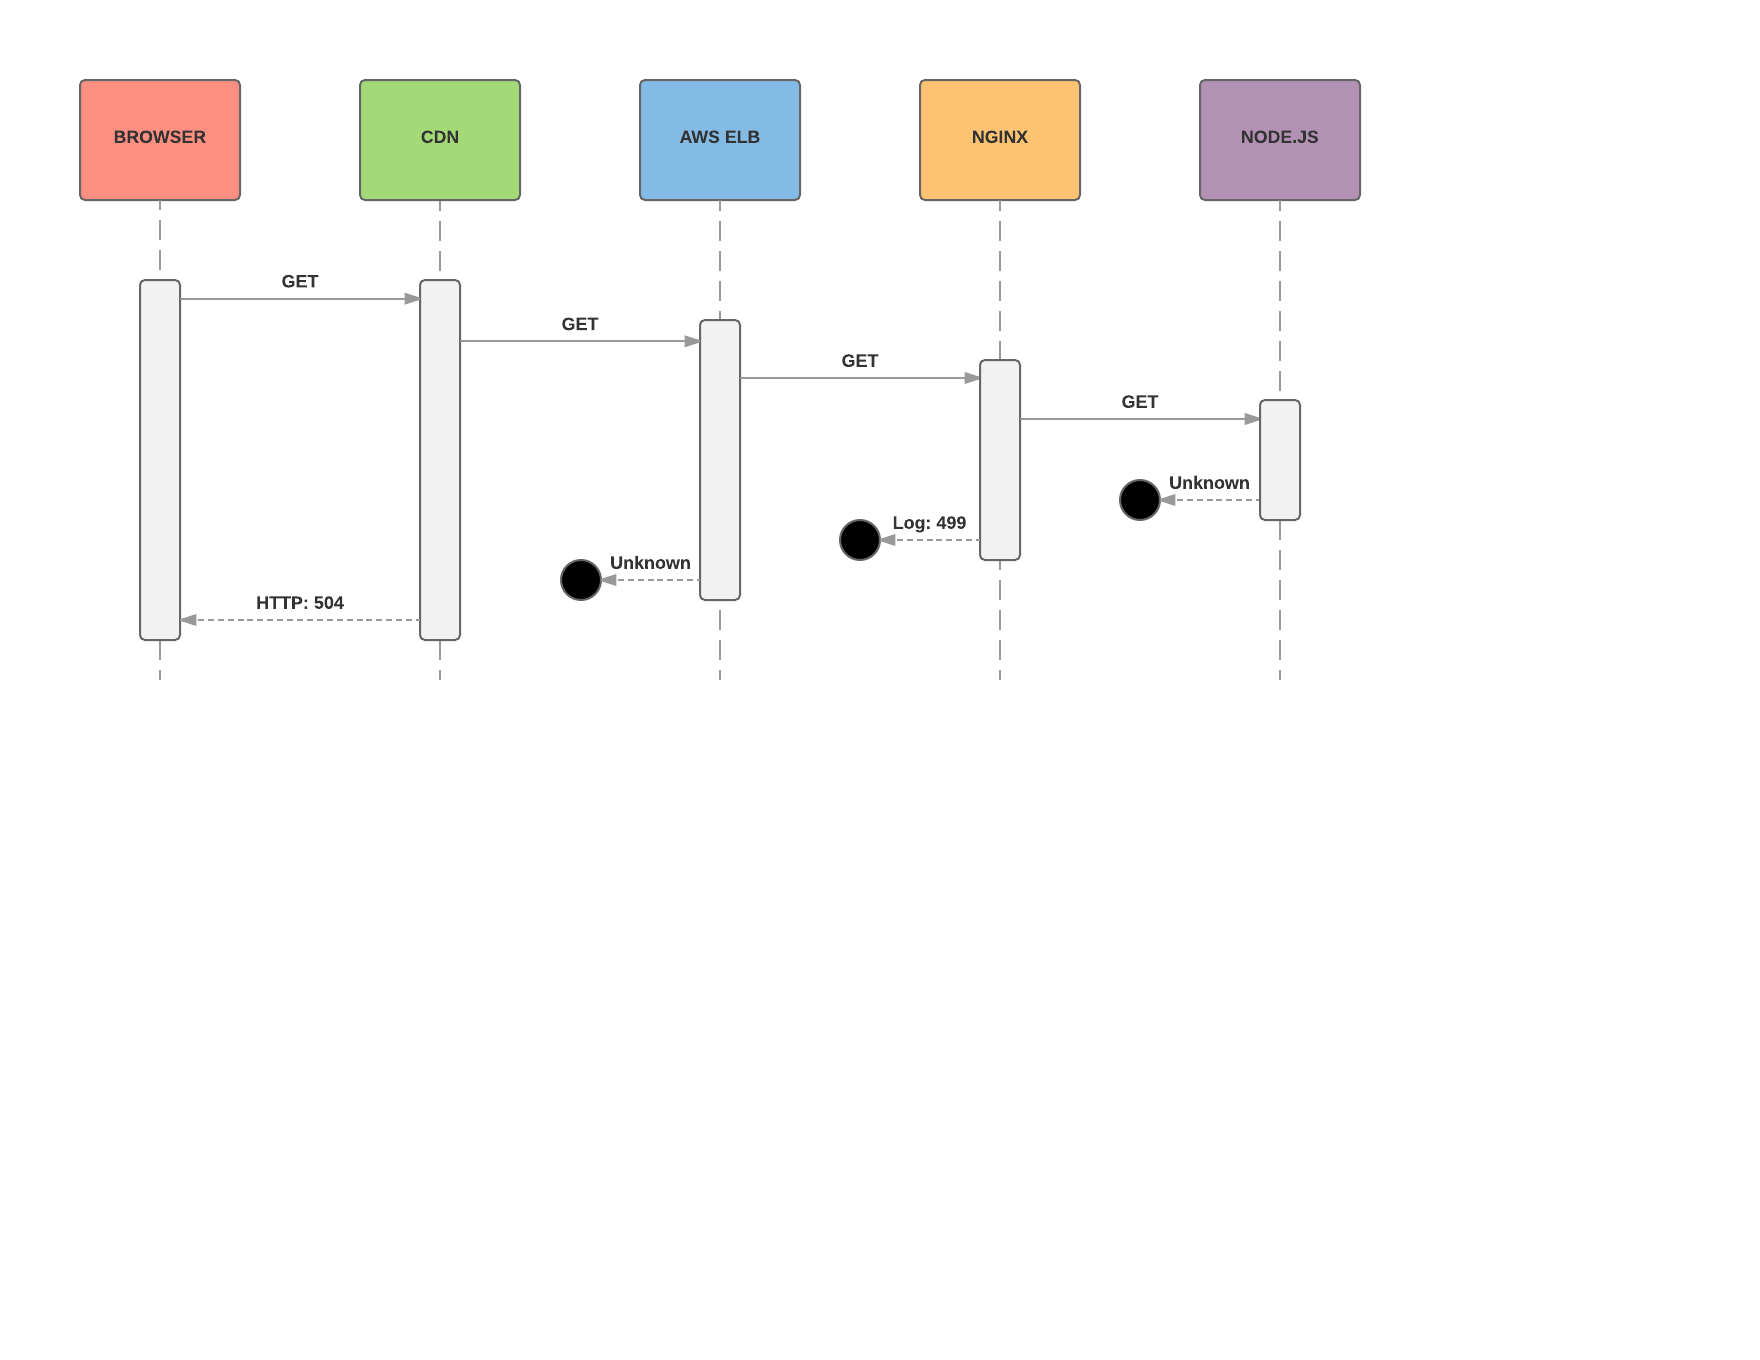
So here’s what we knew:
-
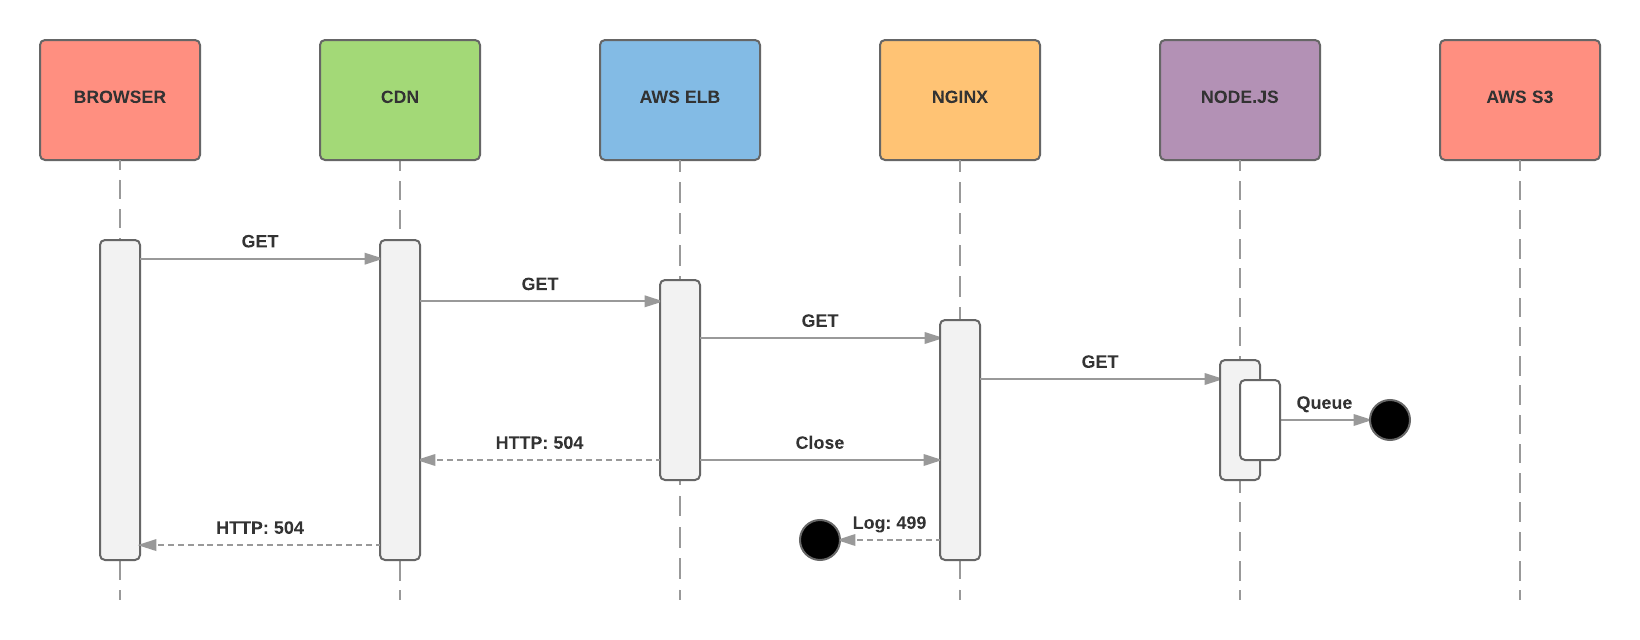
Either our CDN or Load Balancing layer was cancelling some requests and returning status 504 as no timely response was received from upstream
-
Nginx was logging a status 499 when the downstream components cancelled a request
-
Requests to the Content API for static assets were falling into a black hole which meant that image content on the site was failing to display
At this point we decided we had sufficient information about the scope of the issue to consider a mitigation plan.
Stem the bleeding
Our incident response process emphasizes small, non-destructive changes over wholesale repairs where possible. I annoyingly repeat the mantra to my team that we must:
Avoid corrective surgery - just stem the bleeding
Corrective surgery is best performed once the situation has stabilized, we have better information and everyone is cool, calm and collected.
We formed a hypothesis that freshly launched instances of the Content API might behave correctly and we found that we were right! The new servers were not producing any errors once marked in.
We did have the option to instead simply restart the unhealthy instances, but our process also encourages the preservation of evidence. Restarting the instances would have reset their state - and as we learned later - would have reset the key metric we neglected to observe. We might not have found the root cause until the issue surfaced again.
Besides that, servers should be treated like cattle, not pets. A freshly launched instance represents a known good state.
With the healthy instances in rotation, everything stabilized. The 499 log
messages disappeared, our curl test started behaving correctly and users
were confirming a positive outcome.
Root cause analysis
With clearer heads and happy customers, we had the opportunity to take a detailed look at the unhealthy servers and compare them to healthy servers.
A call to $ netstat -t4 shows all TCPv4 sockets on a Linux system. The
following figure shows the results of this call on both an unhealthy (left) and
healthy (right) Content API instance.
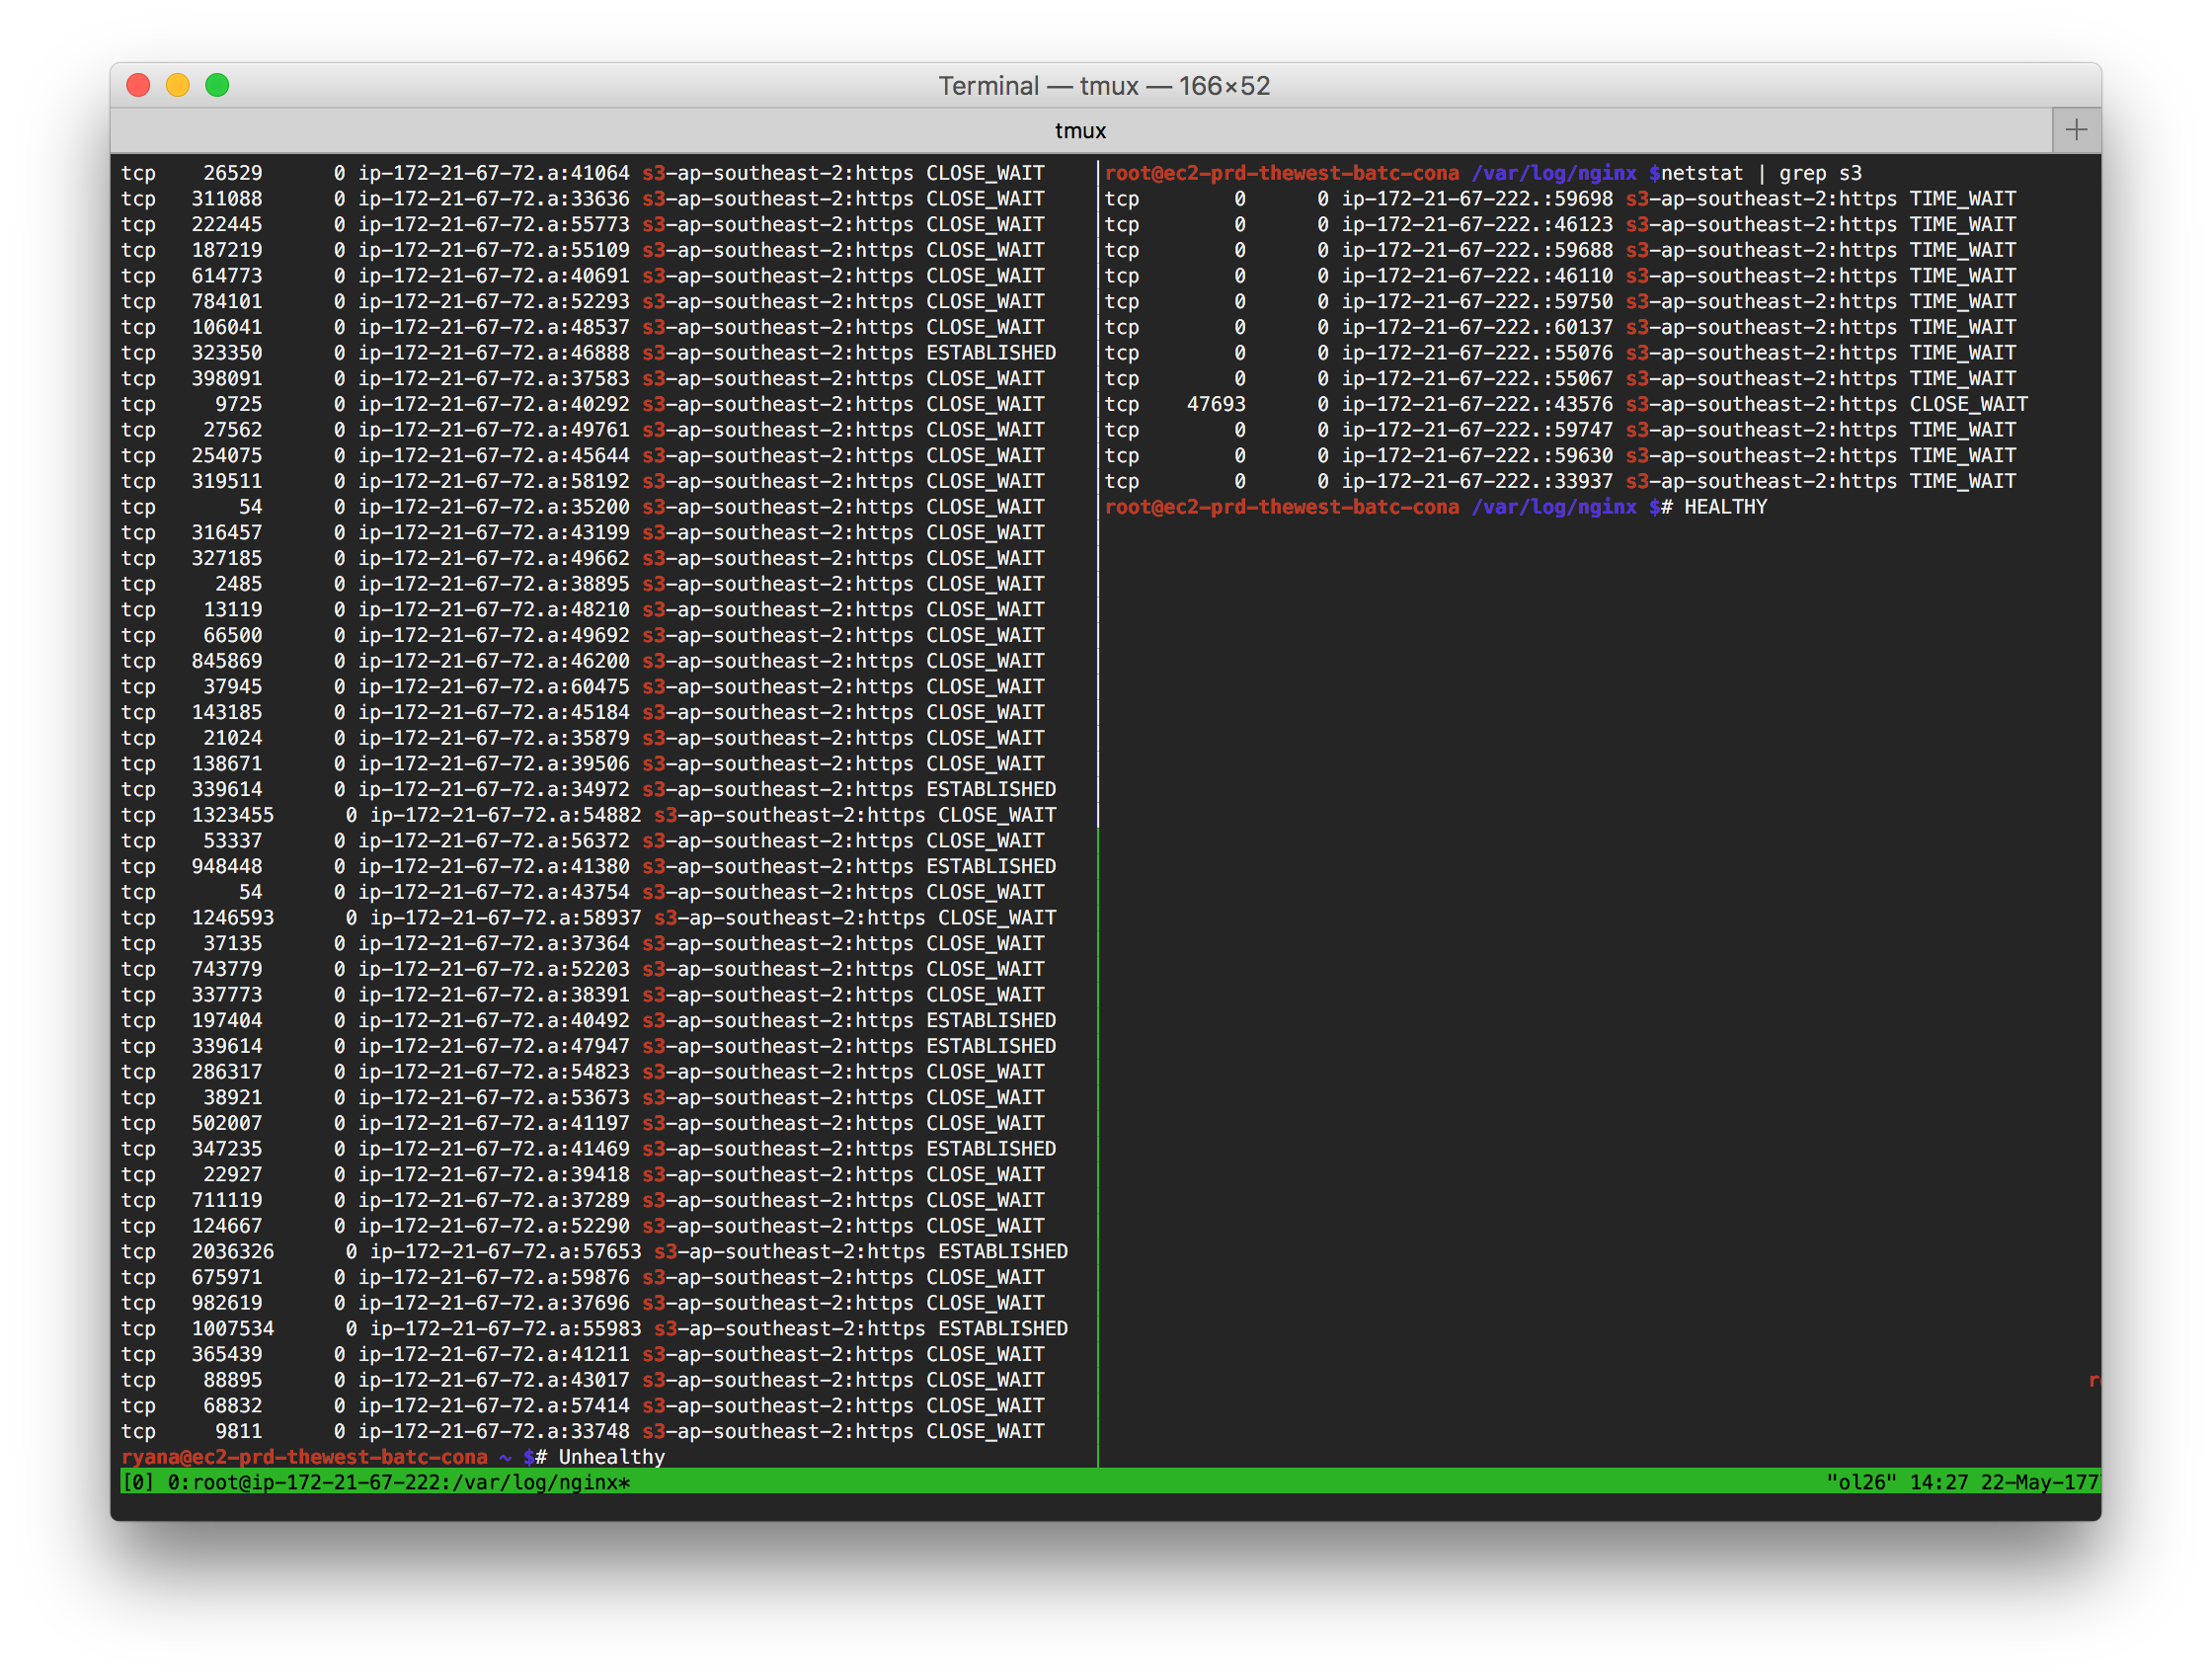
Notice that the unhealthy instance has a large number of sockets in a
CLOSE_WAIT state and also that most sockets have a large quantity of packets
in the Receive Queue (second column). All of these sockets list AWS S3 as the
foreign end point.
By comparison the healthy server has only one CLOSE_WAIT socket and the
Receive Queues are mostly empty, except for the lonely CLOSE_WAIT socket.
Could this be the beginning of a very slow connection leak?
Remember that key metric that we neglected to observe during our network
performance observations? We needed to measure the number of CLOSE_WAIT
sockets on a server. Queue length and the other sockets states might also have
been useful under differing circumstances.
According to Gordon McKinney’s TCP/IP State Transition Diagram,
CLOSE_WAIT indicates that the socket is:
… waiting for a connection termination request from the local user
In our case the “local user” was the Node.js application. Adding -p to the
netstat call printed the PID that owned the leaked sockets. The PID belonged to
our application.
Somewhere in our application, sockets were being created for S3 requests, but never cleaned up. These sockets were exhausting some unknown upper limit, causing new requests to hang.
Now we know where to look and our picture of the control path has a little more detail. Here’s how it looked once the leaked sockets reached critical mass:
We set about tracing the code path for S3 requests in our codebase and found the following.
AWS SDK for Node.js
All of the connections to AWS S3 were being established via the AWS SDK for Node.js.
The SDK uses socket pooling for connections to S3. The default maximum size of
the pool is 50.
If sockets were leaking and there is an upper boundary to the number of active
sockets, it stands to reason that new requests to S3 (in our case, for static
assets) would fail in some way once 50 sockets had leaked. The number 50
anecdotally matched the number of CLOSE_WAIT sockets we had seen with
netstat.
We also found that our version of the SDK had been inadvertently pinned in our codebase to v2.6.14, which was released shortly before we relaunched thewest.com.au.
Given the age of our SDK version, it was conceivable that the socket leak was now a known issue. We trawled through GitHub issues, PRs and the SDK Changelog and found a suspect note in the 2.50.0 release notes:
bugfix: Request: Updates node.js request handling to obey socket read timeouts after response headers have been received. Previously timeouts were being ignored once headers were received, sometimes causing connections to hang.
Inspecting the code also revealed a significant body of other work had also been released concerning sockets.
We formed a hypothesis that updating the AWS SDK would cause all sockets to be cleaned up correctly or emit errors that could be safely handled. There were strong coincidences that suggested this was our issue. Patching the SDK was low risk, easily tested and definitely overdue, but…
Measurements
It was important that we started measuring these socket metrics before implementing a fix. Before-and-after measurements are critical to validate any fix, and they make for great graphics in blog posts (below).
I wrote a Zabbix module named zabbix-module-sockets to capture the following metrics:
-
the number of sockets in each state
-
the sum of the receive queue of all sockets
-
the sum of the send queue of all sockets
With a little simulated load we were able to replicate the connection leak in pre-production environments and measure the results in Zabbix.
The fix
With a reasonable hypothesis, measurements in place and way to validate our plan in pre-production, we deployed the updated AWS SDK to our pre-production environments.
It worked! The following figure from Zabbix shows the dramatic change in behavior around June 2nd, when the fix was subsequently deployed to production.
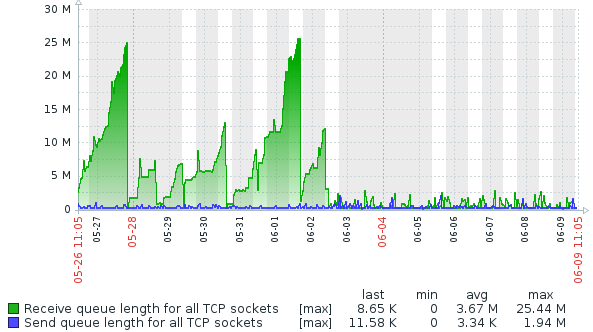
The gradual upward trend of the Receive Queue length (green) stops after the production deployment and the queue length stabilizes. The earlier sawtooth pattern you may observe is caused by application restarts that were triggered to remediate the socket pool being exhausted.
The following figure shows sockets states on the same server. You will notice
the thin, red slice of CLOSE_WAIT sockets discontinues around the time of the
fix deployment.
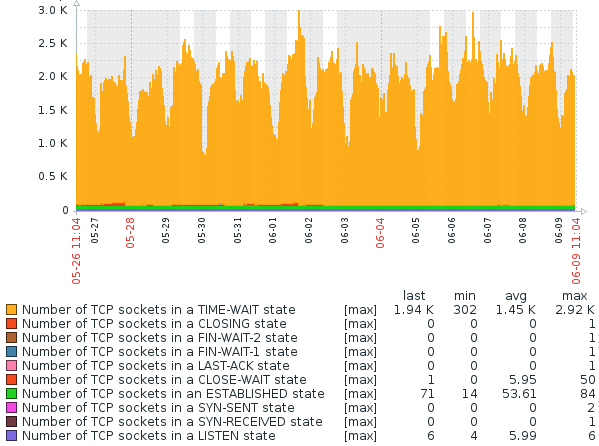
Hey, check out the value in the max column for CLOSE_WAIT sockets…
Case closed.
Lesson learned
In our context, we have to “move fast and break things”. Most things require a trade-off between time-to-market and accrued technical debt. We aim to make the best possible moves with the limited information and resources we have available at any given time.
That said, this event highlighted some priorities that could at least help us to prevent similar issues in the future.
Alert on 499 responses
For HTTP servers that support HTTP 499 like nginx, a small number of
499 Client Closed Request responses should be expected at the edge, where
clients do have the prerogative to disconnect prematurely. But in higher
frequency, or at other points in your signal chain, these responses might
indicate that timeouts are incorrectly configured. So…
Get your timeouts right
Each component should be configured with a timeout that is longer than all its upstream dependencies. By example, if you have a 3 second timeout on database queries, then the application server should not cancel requests any sooner than this. Otherwise the source of a problem is obscured and all you are presented with is a timeout error from a component other that the one that misbehaved - as we experienced.
This solution is complicated by services that need multiple round-trips or have asynchronous behaviors, but…
Everything should be bounded
There is an expected operational behavior of every component in our system. Any operation that completes too quickly or too slowly should create an error that is meaningfully propagated, logged and alerted on.
In this case, our Content API servers should have been configured with a tightly constrained timeout on all requests to S3. Error handlers in our code would then have sent a meaningful 5xx error back downstream.
This principle should also apply to the incoming request to the API. We should cancel any request that runs too long, for any reason. This has operational advantages, but is also good security practice to mitigate denial of service.
Health checks must validate all dependencies

Each of our micro-services has a health check route that quickly validates each of its known dependencies (e.g. it can connect to the database, write to a log file, etc.). In this case we had neglected to include S3 in the dependency checks. As a result, each service was advertising itself as healthy.
If we had included S3 in the health checks, the checks would have failed, these instances would have been marked out of the load balancer, alerts would have escalated and new healthy instances would have been rolled in automatically.
Summary
Under the stress of trying to restore services, we never felt any hunch to check the battle-hardened AWS SDK for leaked sockets to the notoriously reliable AWS S3 service. But this was our root cause.
As unlikely as the issue was, having a response plan in place and sticking to it gave us the best possible outcomes:
-
We followed the facts and found the root cause
-
Services were restored quickly, without introducing unnecessary risk or destroying evidence
-
We uncovered other weaknesses in our systems that could be addressed before they led to disaster
-
We learned a whole lot about the software and systems we work with
Thanks for reading! I’d love to hear your thoughts in the comments section below.
Appendix: Leaks from other buckets
With our new socket monitoring in place in Zabbix, we noticed a much smaller number of sockets to S3 being leaked on almost all of our application servers.
We discovered that the AWS CodeDeploy Agent was the culprit. We use CodeDeploy to deploy our Node.js applications and S3 is used as the storage backend.
Fortunately, these sockets leak much slower (we’ve only seen up to 3 on any one instance). For now, routine restarts will suffice until AWS are able to address the issue.